Digital Twin Feature Update: August
Dear readers,
In our feature update for version 2025.8 of our heatbeat Digital Twin, we would like to highlight some of the key developments we have made recently. The most notable additions in our latest weekly updates to the Digital Twin are the display of measurement data KPIs and the beta version of network editing.
Measurement data KPIs
Automated key performance indicators (KPIs) are now available, allowing you to analyse your measurement data from transfer stations – whether live or historical – in depth.
These KPIs were developed as part of a research project and enable valuable conclusions to be drawn about the performance of the transfer stations and potential for optimisation.
The KPIs at a glance:
- Compliance with return temperature limits
Measures the percentage of time during which the return temperature is below a defined limit. An indicator of thermal efficiency and compliance with technical specifications. - Connection capacity utilisation
Shows the ratio between the highest measured power and the contractually agreed connection capacity. This key figure helps to identify oversizing or undersizing. - Data availability and quality
Evaluates the completeness, temporal resolution and plausibility of the measurement data. High data quality is a prerequisite for reliable analyses and decisions. - Potential for volume reduction
Indicates the proportion of the measured volume flow that could theoretically be reduced without compromising the security of supply. This indicates potential efficiency reserves. - Variability of the volume flow
Describes how dynamically the volume flow responds to the actual heating load. High variability indicates demand-oriented and flexible operation. - Detectability of night-time reductions
Analyses whether a further reduction occurs after an initial reduction in the volume flow – a sign of an optimised control strategy.
These KPIs can be flexibly applied to different time periods. This allows you to perform seasonal or project-related analyses.
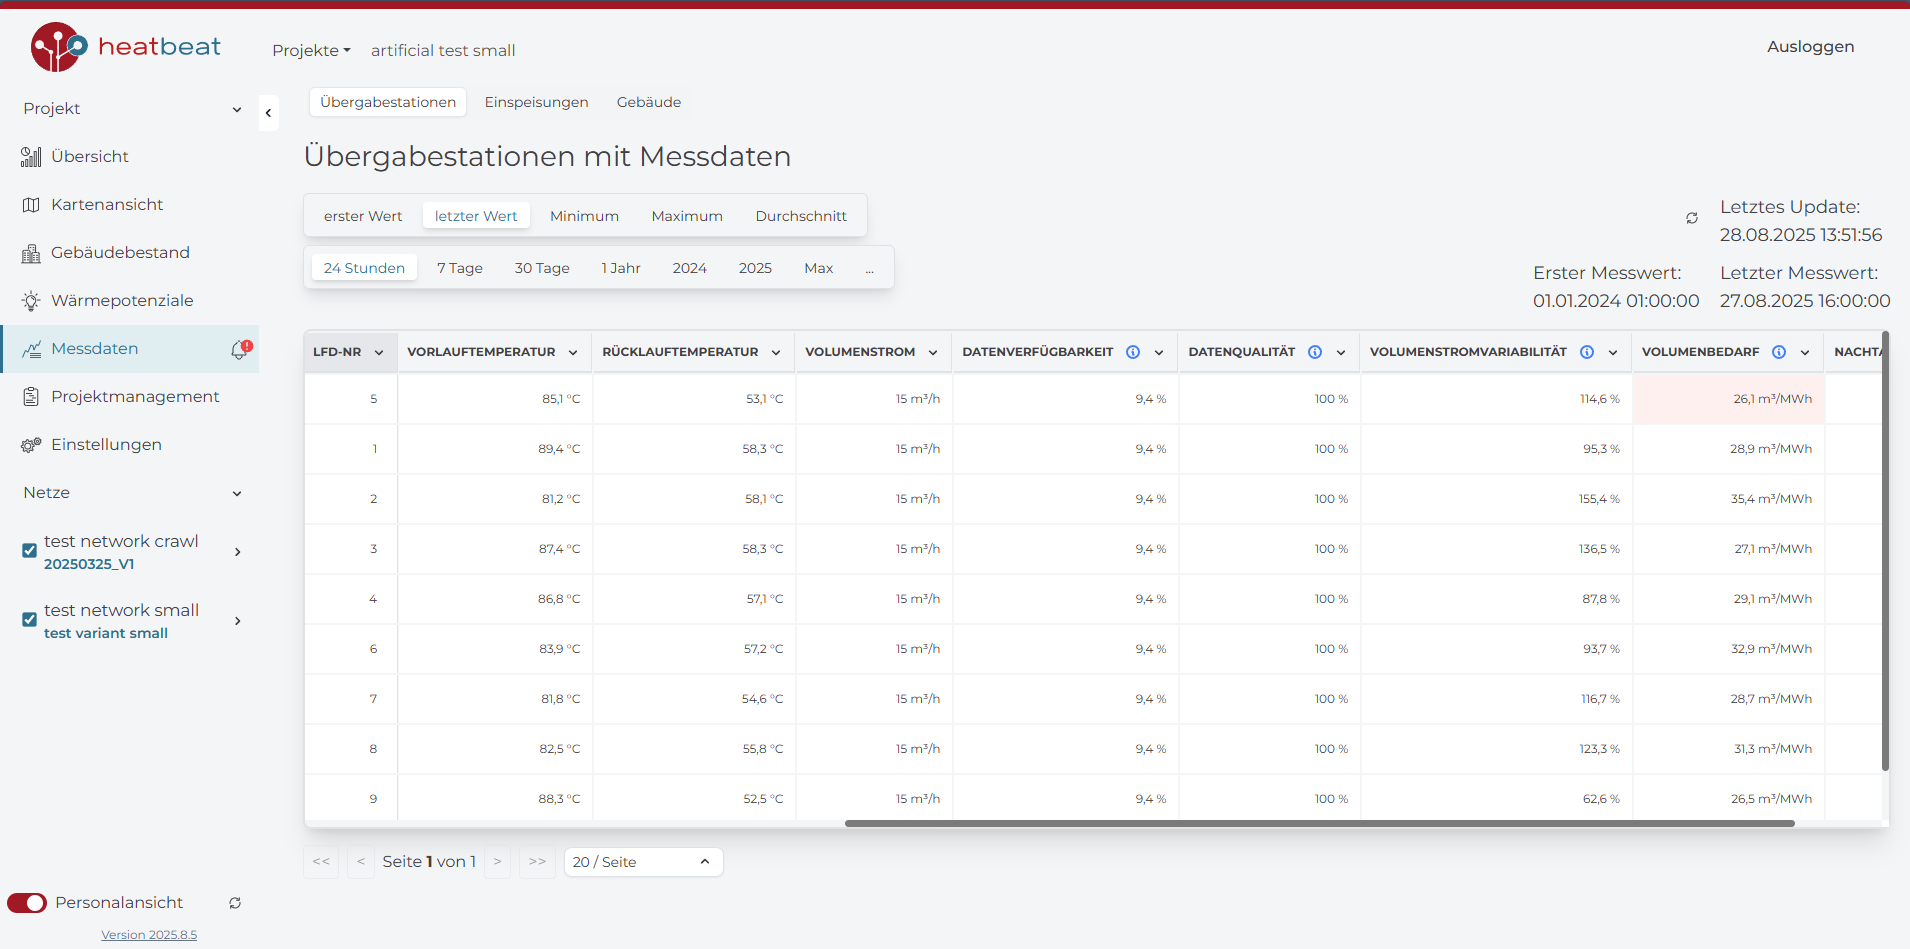
The results can be viewed directly in the measurement data table. This allows you to conveniently compare, sort and evaluate the values of your transfer stations. Whether you are looking for the best data quality, the highest volume reduction potential or the most reliable compliance with the connected load – with just a few clicks, you can obtain a clear overview and ranking of your transfer stations.
Another highlight is that the KPI results are also available in a georeferenced map view. This allows you to link your analysis directly to the grid connection and quickly identify spatial patterns or anomalies.
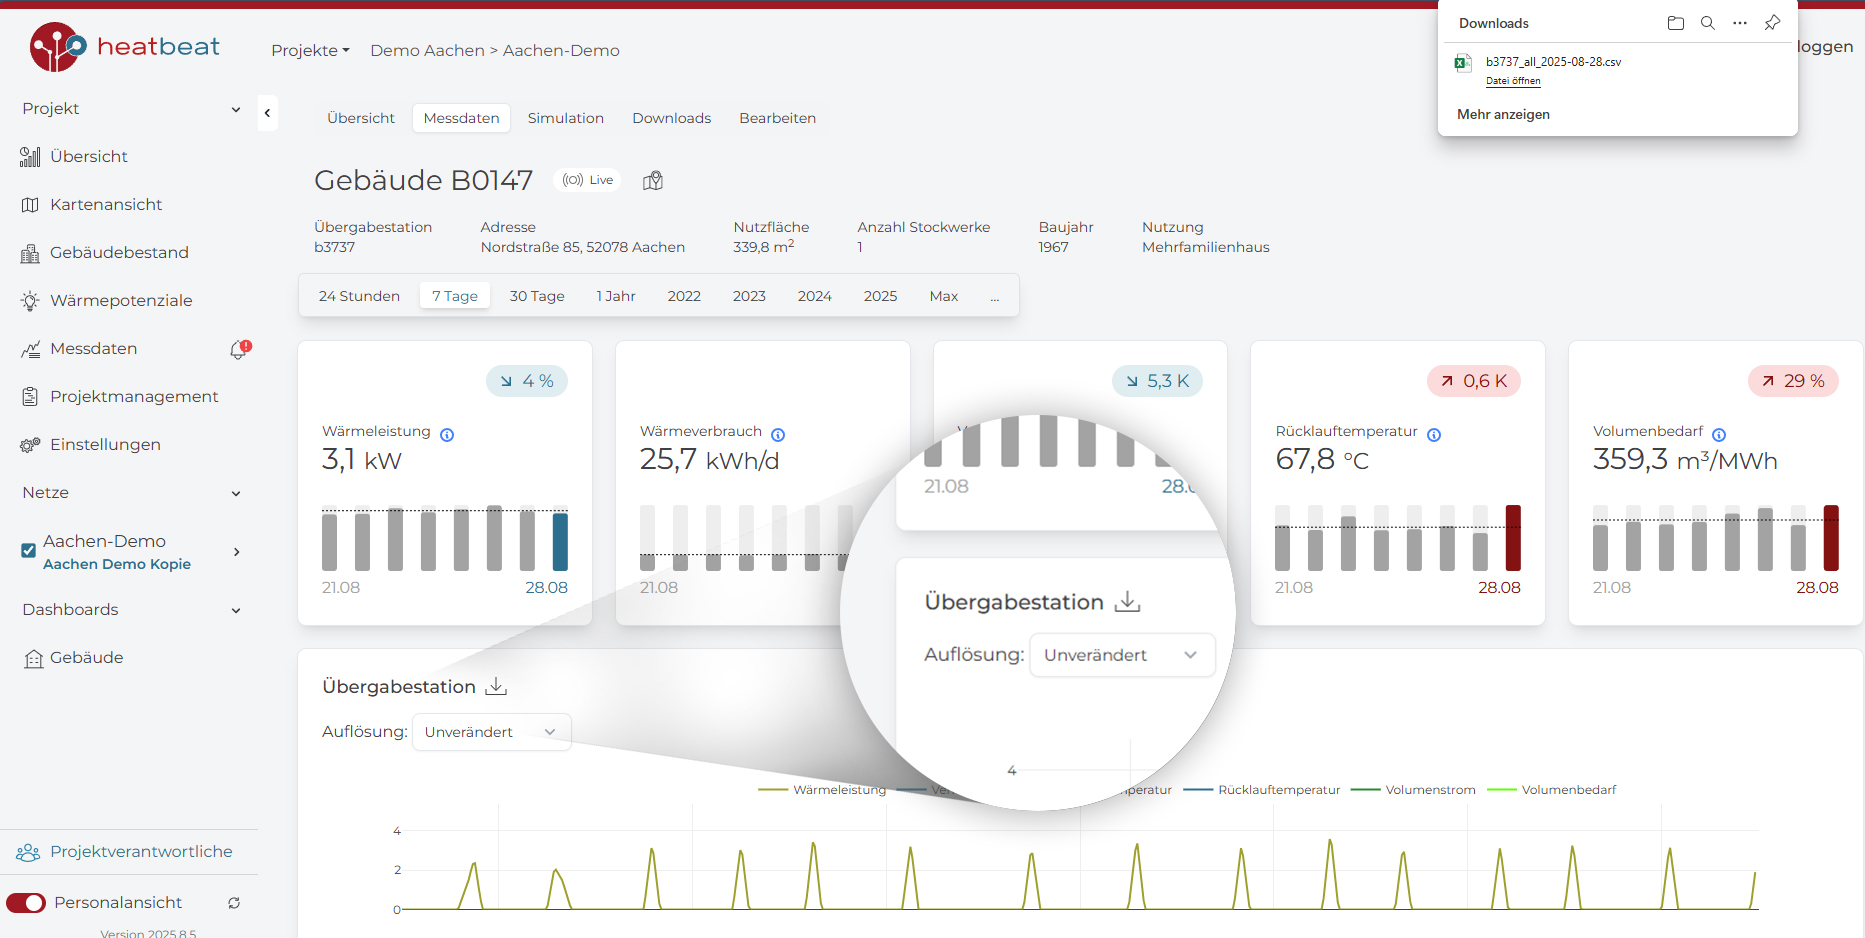
In addition, the data from the measurement series can be easily downloaded as a CSV file, allowing you to use your data in a prepared form for further processing.
Beta version network editing tool
The new interactive drawing tool for network editing now allows you to create, edit and expand your network directly via the map view.
With just a few clicks, you can connect additional buildings in your building stock to your network, create new buildings in your neighbourhood yourself, or conveniently add entire sub-areas to your network using the lasso tool.
Have fun trying it out.
Your heatbeat team


