Digital Twin Feature Update: December
High-resolution download of the map view
The map view is the heart of the Digital Twin. It combines a wealth of georeferenced information and makes complex relationships visible at a glance – whether for municipal heat planning or network expansion. This visual representation is not only indispensable for day-to-day work, but also extremely valuable for strategic communication, presentations and marketing materials.
To make this even easier and more professional, we have introduced high-resolution downloads of the map view. This allows you to export the current view with the activated layers in excellent quality in SVG format.
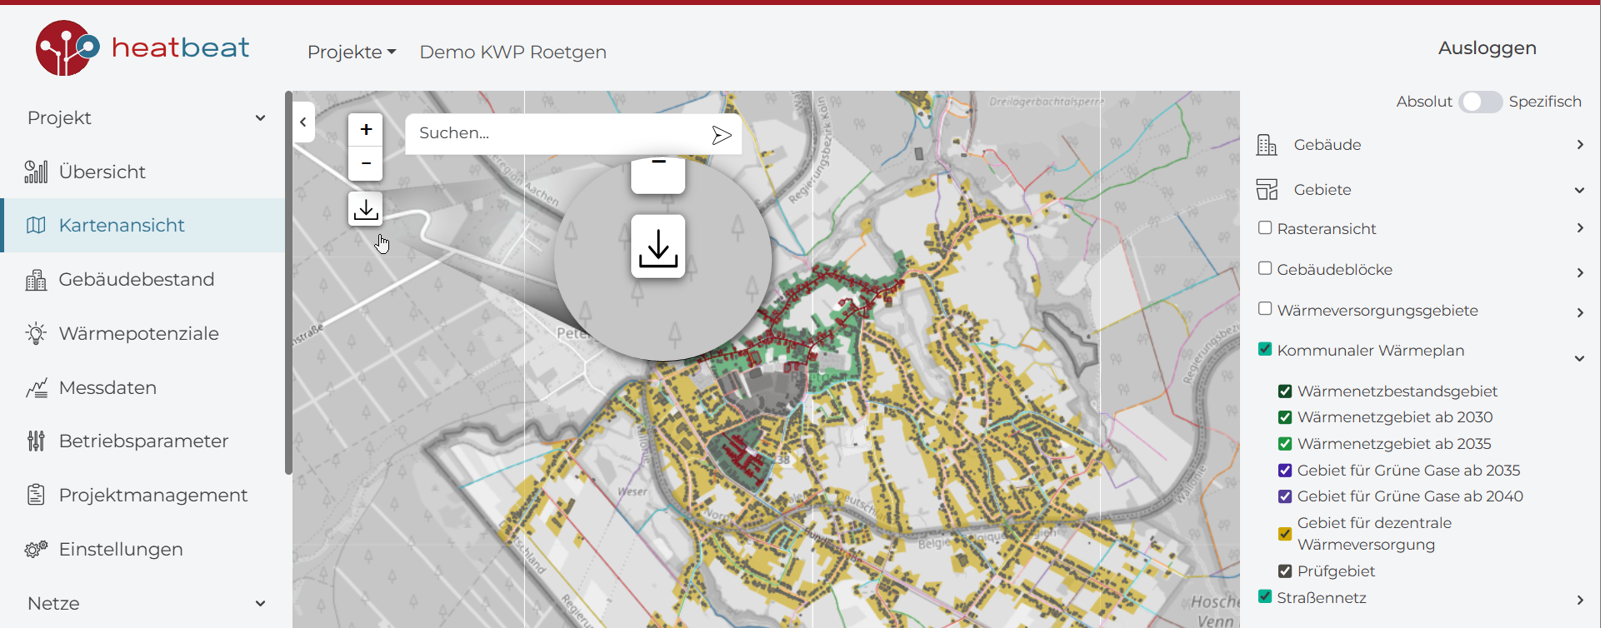
The download includes map material from OpenStreetMap or the geodata centre, depending on your configuration in the Digital Twin. This ensures that you always have the right basis for your visualisations.
Improved planning of expansion scenarios
The Digital Twin is now even more powerful with the new function for recording the theoretically required power demand for all buildings. This extension makes it possible to estimate and document the heat demand not only for connected buildings, but also for previously unserved properties. This creates a complete data basis for planning expansion scenarios.
The big advantage: planners and utilities can use this information to develop realistic variants, integrate new buildings into the network infrastructure and then carry out dimensioning and simulations. This allows different scenarios to be compared and informed decisions to be made.
The function creates:
- Greater transparency across the entire building stock
- Better planning for future investments
- Efficient scenario evaluation through simulation results
- Time savings, as all relevant data is available centrally in the Digital Twin
In short: with the power demand function, the Digital Twin becomes a strategic tool for future-proof heat planning.
Feature Update Live
On 1 October, we launched the first Feature Update Live – our new quarterly format that provides concise and practical information about the latest developments in the heatbeat Digital Twin. The webinar series summarises the highlights in a practical and interactive way!
The next dates have already been set and registration is now open via the following links:


