Network simulation and visualization of results
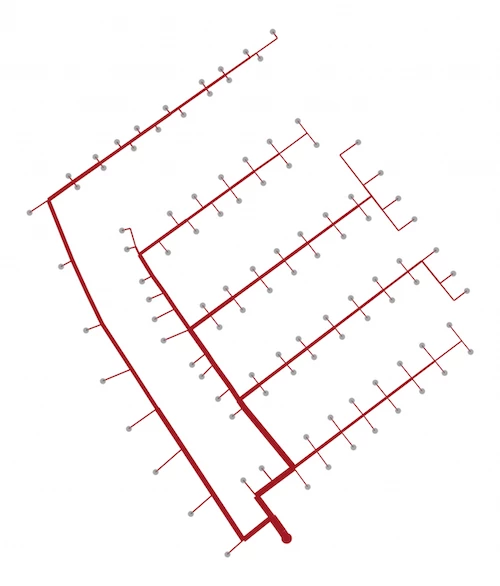
The simulated heat demands from the previous page are then linked to the network data in our simulation environment. These demands form the basis to estimate suitable pipe diameters to cover the simulated peak demand in the network. The following figure illustrates the resulting pipe diameters in the network where a larger line thickness indicates a larger pipe diameter.

This results in the following distribution of the pipe diameters in the network per line length:
Whereas our simulation environment can also model control strategies for variable network temperatures, we assume a constant flow temperature at the feed-in of 70 °C and a set return temperature of 50 °C for our simple usecase. To model the influence of the surrounding soil on the heat losses the network, we prescribe a variable temperature for the undisturbed soil at a depth of 1 m in our simulation.
For our case study, we use the assumptions made above for 3 variants, which differ only in the selected thermal insulation class of the pipes. This results in a variant with low, medium, and high thermal pipe insulation, respectively.
To visualize the simulation results, we first show the results of the variant with a medium thermal insulation before we continue with the final comparison of the variants. As a first result of our network simulation, the following network temperatures can be determined at the supply station.
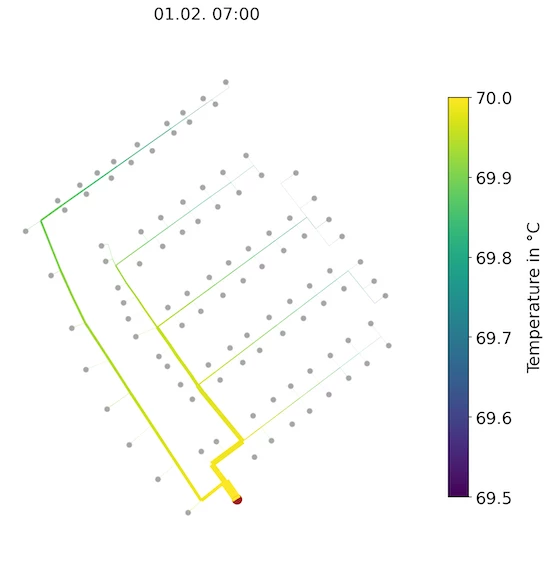
In addition to this temporal perspective, the results can also be regarding their spatial distribution. The following figure shows an example of the distribution of the flow temperatures in the network at the time of the highest heat load in the network.

The corresponding pressures at the same time can be illustrated as shown in the following figure. Here you can see the hydraulic behavior of the supply and return network depending on the heat demands of the buildings in the network over one day. For this purpose, a simple worst-point control of the supply pressure with a constant return pressure at the feed-in was assumed.


